
ECharts插件实现3D饼图
日期: 2018-01-25 分类: 个人收藏 475次阅读

1.下载Echarts插件,官网地址:http://echarts.baidu.com/download.html
下载开发版本: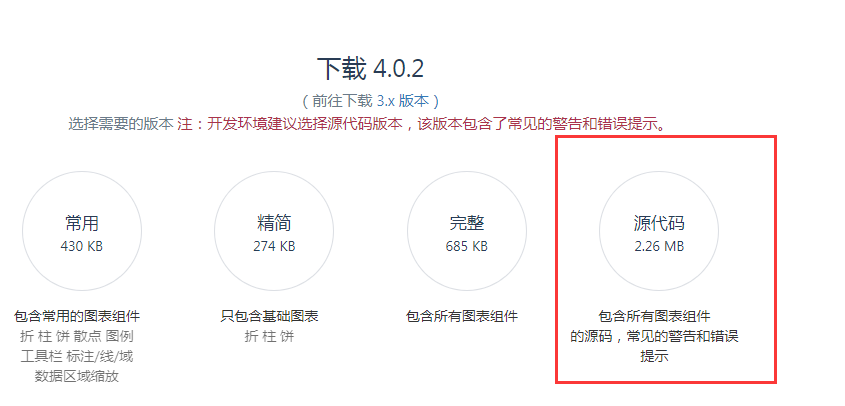
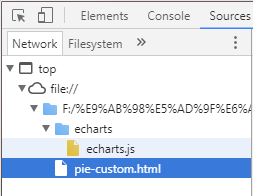
2.引入到html中
文件层级:
源码部分:
<!DOCTYPE html>
<html style="height: 100%">
   <head>
       <meta charset="utf-8">
   </head>
   <body style="height: 100%; margin: 0">
<div id="container" style="height: 100%"></div>
<script type="text/javascript" src="echarts/echarts.js"></script>
<script type="text/javascript">
var dom = document.getElementById("container");
var myChart = echarts.init(dom);
var app = {};
option = null;
option = {
    backgroundColor:'#FAFAD2',
    title: {
        text: '国民营销信息来源渠道',
        left: 'center',
		//标题栏的高度,值越大,距离顶部的距离越大
        top: 50,
		//标题栏字体的颜色
        textStyle: {
            color: '#FFD700'
        }
    },

    tooltip : {
        trigger: 'item',
        formatter: "{a} <br/>{b} : {c} ({d}%)"
    },

    visualMap: {
        show: false,
		//饼图中在最大值最小值颜色范围中的亮度,值越大颜色越深
        min:10,
        max: 600,
        inRange: {
		//0-1之间,值越小颜色越深
            colorLightness: [0, 1]
        }
    },
    series : [
        {
		    //饼图中内容介绍
            name:'客户访问来源',
			//统计表的类型
            type:'pie',
			//饼图的弧度,值越小生成的饼状图越小
            radius : '60%',
			//饼图生成后的位置
            center: ['50%', '50%'],
            data:[
                {value:335, name:'直接访问'},
                {value:310, name:'邮件营销'},
                {value:274, name:'联盟广告'},
                {value:235, name:'视频广告'},
                {value:400, name:'搜索引擎'}
            ].sort(function (a, b) { return a.value - b.value; }),
            roseType: 'radius',
			//饼状图的外围标签
            label: {
                normal: {
                    textStyle: {
                        color: 'rgba(0, 0, 0, 0.3)'
                    }
                }
            },
			//指向外围标签的线条
            labelLine: {
                normal: {
                    lineStyle: {
                        color: 'rgba(0, 0, 255, 0.3)'
                    },
                    smooth: 0.2,
                    length: 10,
                    length2: 20
                }
            },
            itemStyle: {
                normal: {
				   //具体决定了饼状图每一份的颜色显示
                    color: '#FFA07A',
					//饼状图阴影,值越大阴影亮度越高
                    shadowBlur: 200,
                    shadowColor: 'rgba(0, 0, 0, 0.5)'
                }
            },

            animationType: 'scale',
            animationEasing: 'elasticOut',
			//图表生成的随机时间
            animationDelay: function (idx) {
                return Math.random() * 200;
            }
        }
    ]
};;
//选中
if (option && typeof option === "object") {
    myChart.setOption(option, true);
}
       </script>
   </body>
</html>
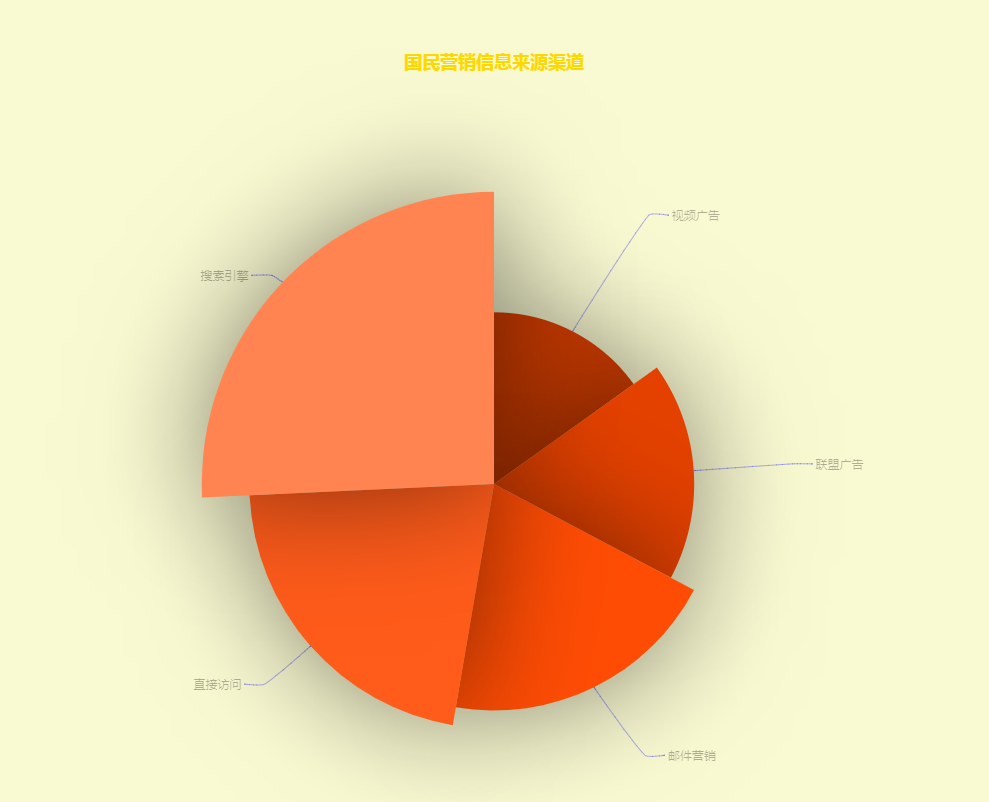
实现的效果:
转载于:https://my.oschina.net/u/3544533/blog/1612830
除特别声明,本站所有文章均为原创,如需转载请以超级链接形式注明出处:SmartCat's Blog
精华推荐